Ap Physics Lab Example
Lab 1: Measurements and Graphical Analysis
Purpose Statement: Given “disks” of different radii, determine the relationship between the mass and radius of the disks through graphical method. In using graphical method, we will learn about linearization and the use of it to create a mathematical model.
Outline of Procedure:
-
Foil disks of differing sizes are collected.
-
The radius of each disk is measured in cm, and multiplied by itself to calculate r2.
-
A disk is chosen at random, and folded in half 4 times. The thickness of the folded disk is measured, then divided by 16 to produce the actual thickness of the original disk (unfolded). Each disk has been cut from the same foil sheet, hence the thickness of disks are uniform.
-
Each disk is weighed on a scale, and mass is recorded in a data table.
What is the precision of the meterstick I used? Explain how you know this based on the data I provided.
The precision of the meterstick is to the tenth of a centimeter, in terms of measurement. When my group measured the actual disks, we went one significant figure beyond the shown measurement.
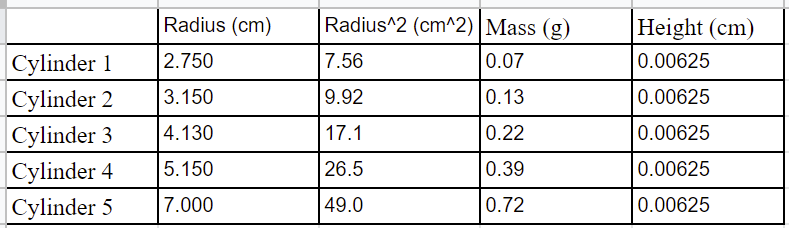
Data Table:
Cylinder Height (cm), Mass (g), and Calculated Radius2 (cm2) Values
Graphs:
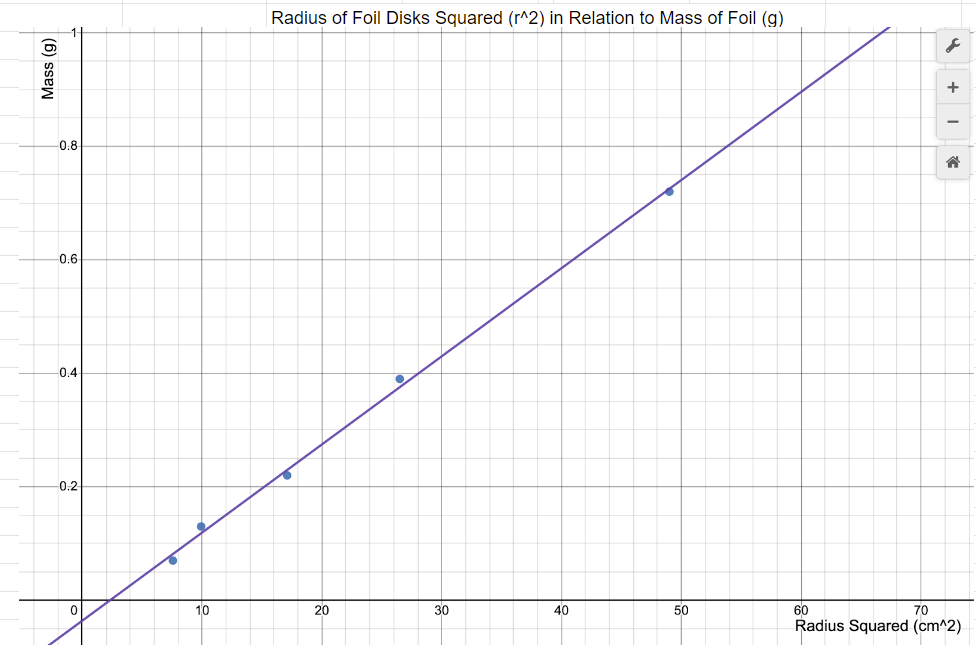
m = 0.016r^2 - 0.036
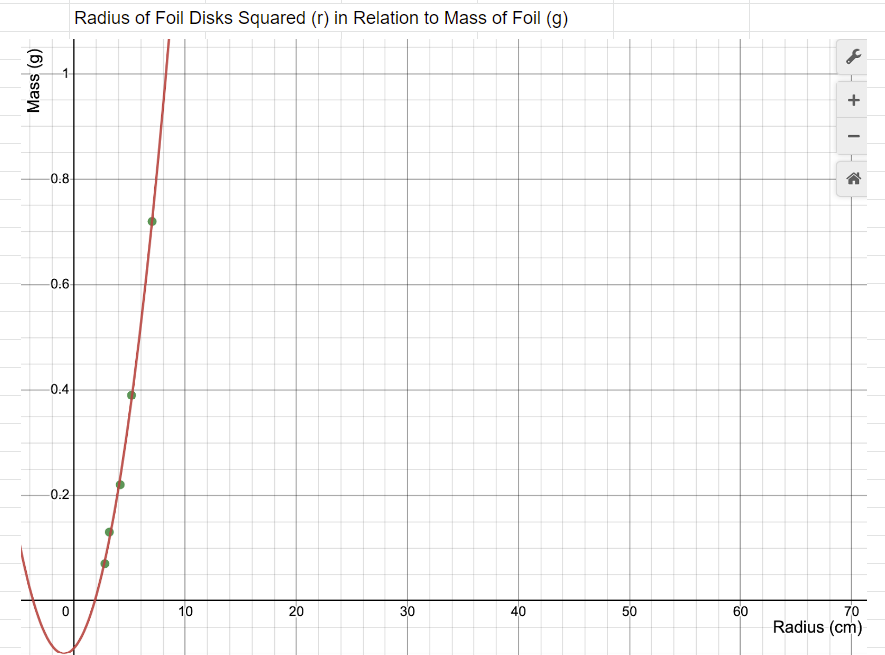
m = 0.013r^2 + 0.024r - 0.090
Analysis Questions:
-
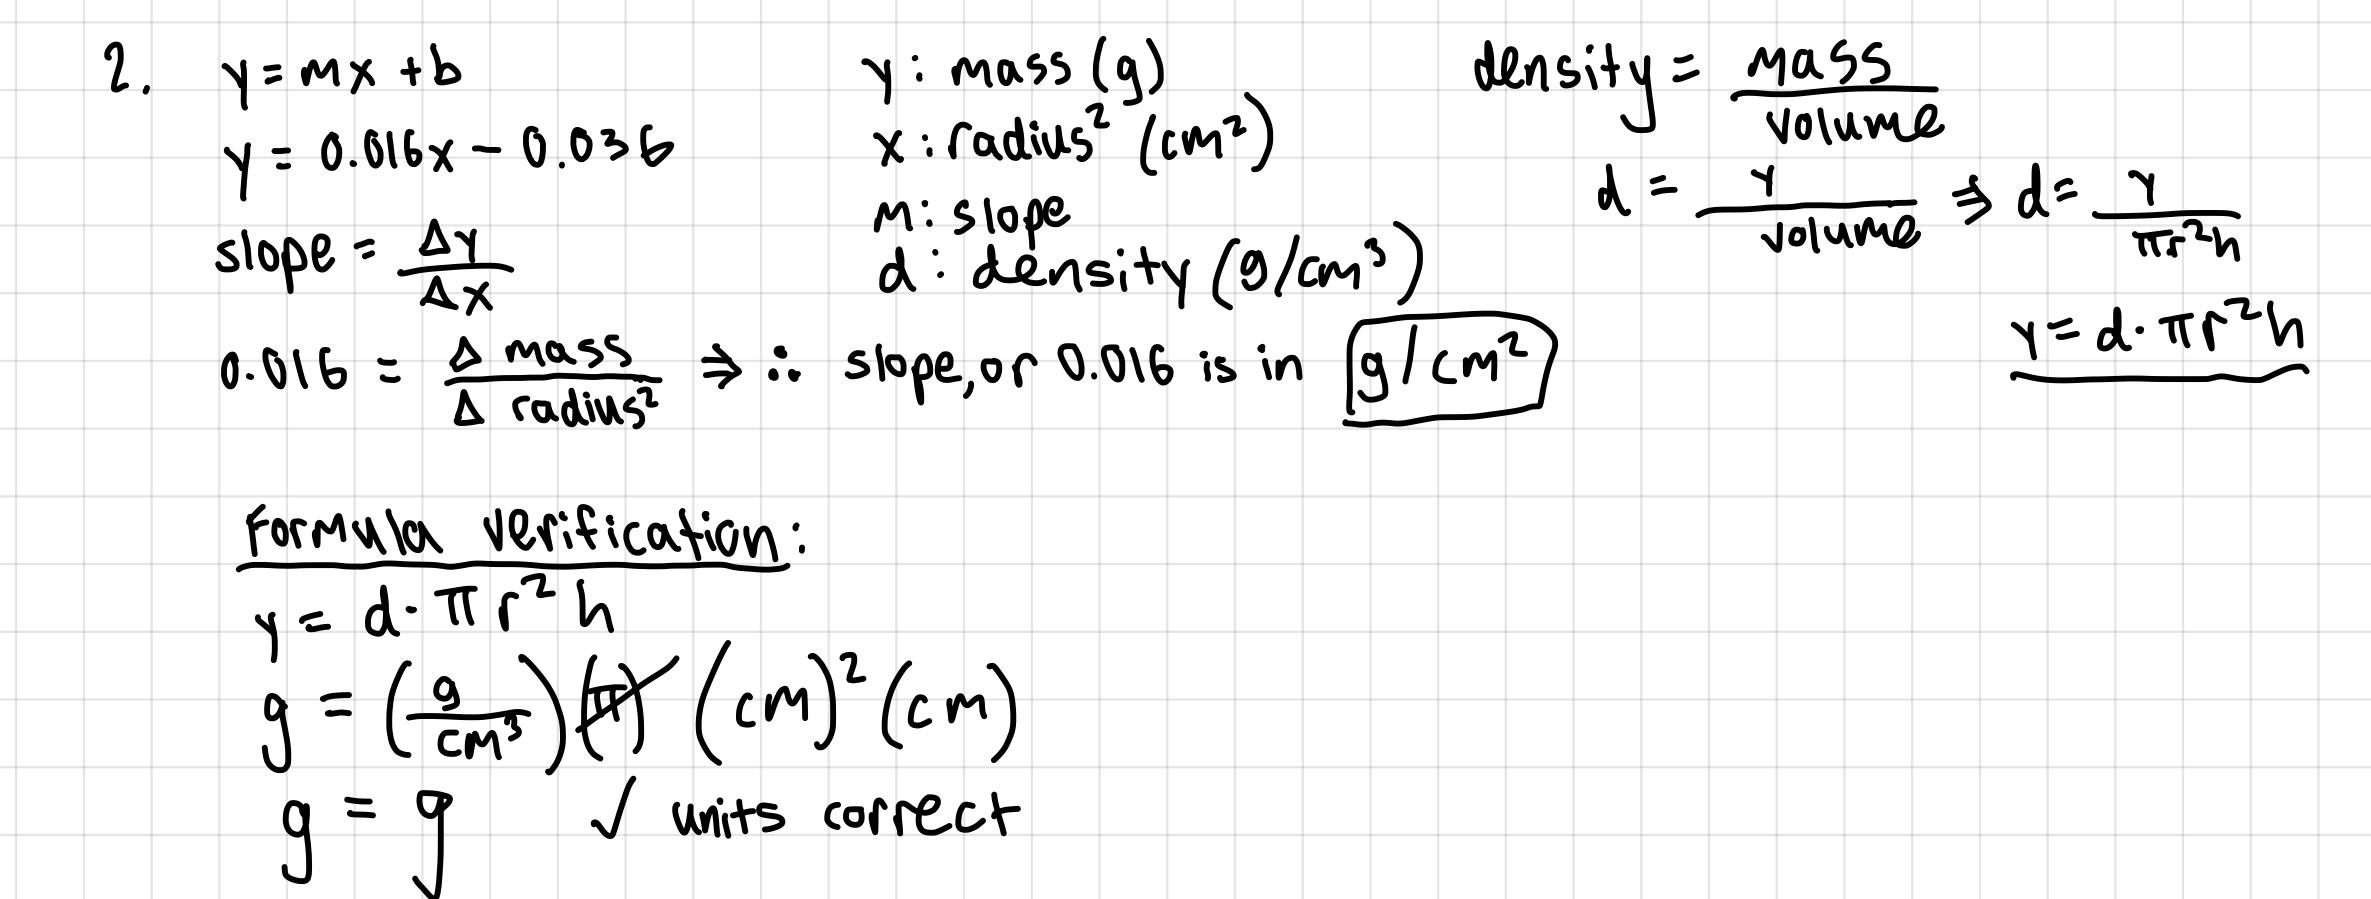
What is the independent variable in your y = mx +b formula?
The independent variable in our y = 0.016x - 0.036 is x, or radius2 (cm2).
-
What does the slope represent in your y = mx +b formula? Show dimensionally that indeed that is what your slope represents and that the formula is valid dimensionally.
The slope is 0.016, which is grams / cm2. The slope is change in mass of cylinder over quantity of change in radius2.
-
Should the “b” in your y = mx + b formula be zero? Explain your answer.
No, the b should not be 0 due to data collection errors. In a perfect world, the line of best fit would go through the origin since if the radius is 0 cm, then radius2 is also 0 cm2, hence the mass would be 0 g. However, due to human error, the data values for radius and mass are not exact, hence the line of best fit that will best represent the data does not go through the origin. A line of best fit should represent all the data points best, not just the origin.
-
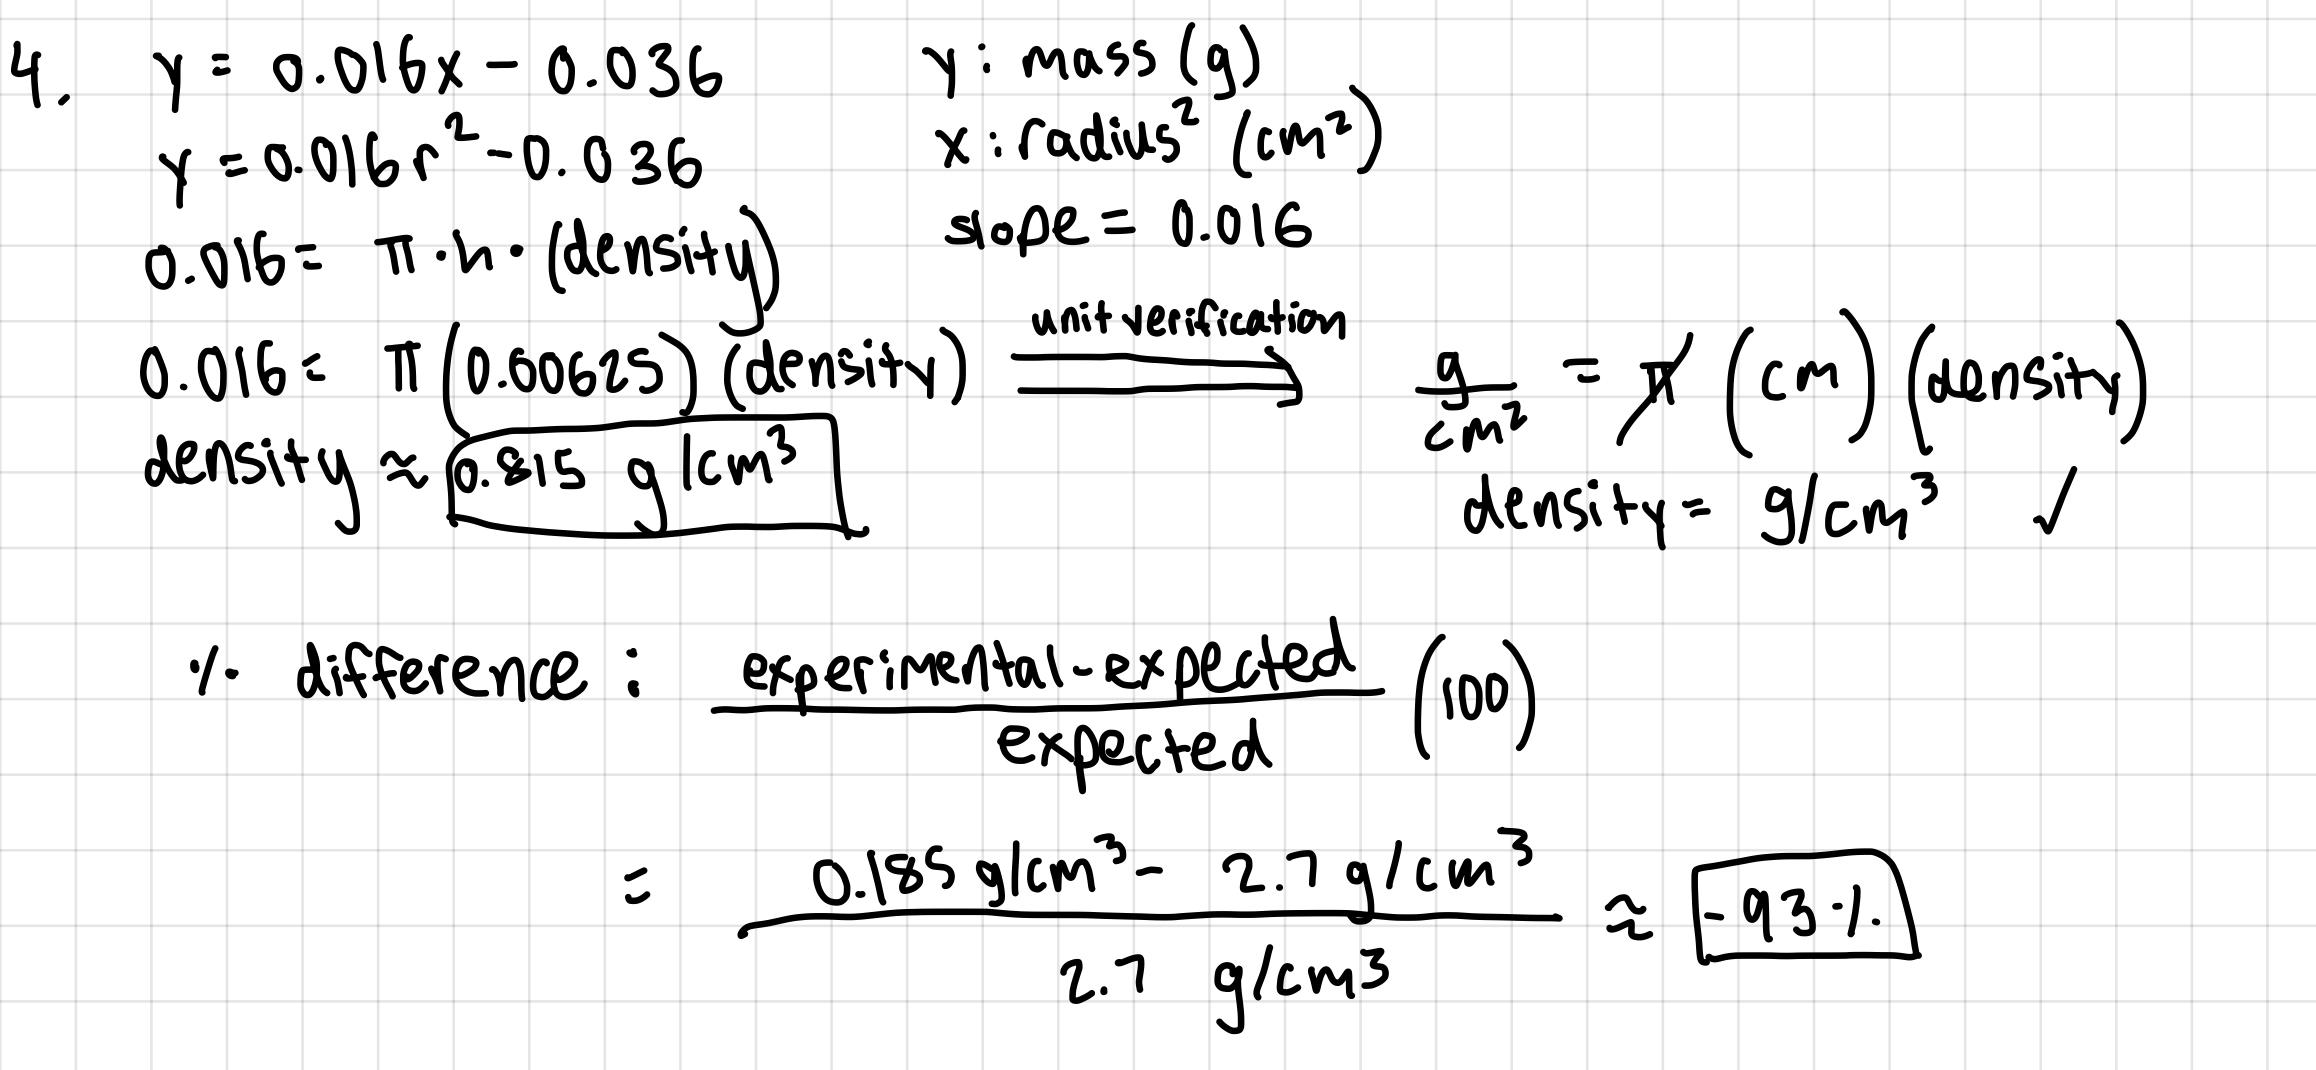
Measure/estimate the “thickness” of your cylinders. Use that value to find the experimental density of your cylinders. Find a percent difference between your found density and the actual density. The actual material is aluminum.
-
The estimated value for “thickness” is 0.00625 cm. The calculated value of density of the disk is 0.815 g/cm3 (calculations shown below).
-
-
The calculated percent difference between actual density (2.7 g/cm3) and calculated density (0.815 g/cm3) is -93%.
-
errors. Make sure you explain why your number is bigger or smaller than (if positive or negative difference.)
-
Some of the aluminum disks had tiny holes or deficiencies, which likely means that mass measured is inaccurate. The thickness of each disk was extremely small, making it a difficult quantity to measure; hence, there are measurement inaccuracies present due to human error/ limitations.
-
Synthesis Questions:
-
In this experiment, if we had used disks with greater thickness, would the slope of your best fit line have been different? Would your experimental value for density be the same? Explain.
-
If the disks had a greater thickness, then the slope of the best fit line would be different. A greater thickness of the cylinders would result in a higher mass, even if the radius was the same. Hence, the slope of the line of the graph r2, on the x-axis, and mass in g, on the y-axis, would be greater (calculated by taking change in mass over change in r2).
-
However, the density would not change. Once the slope of the best fit line is found, it is plugged into the equation slope = (pi)(thickness or height of cylinder)(density). Density is then solved for; the procedure has been demonstrated on analysis question 4. Since the thickness value plugged into this equation is also increased (along with slope), the density value would not be affected. Theoretically, the density value would not change anyway because the material, aluminum, remains the same no matter the thickness of the disk.
-
-
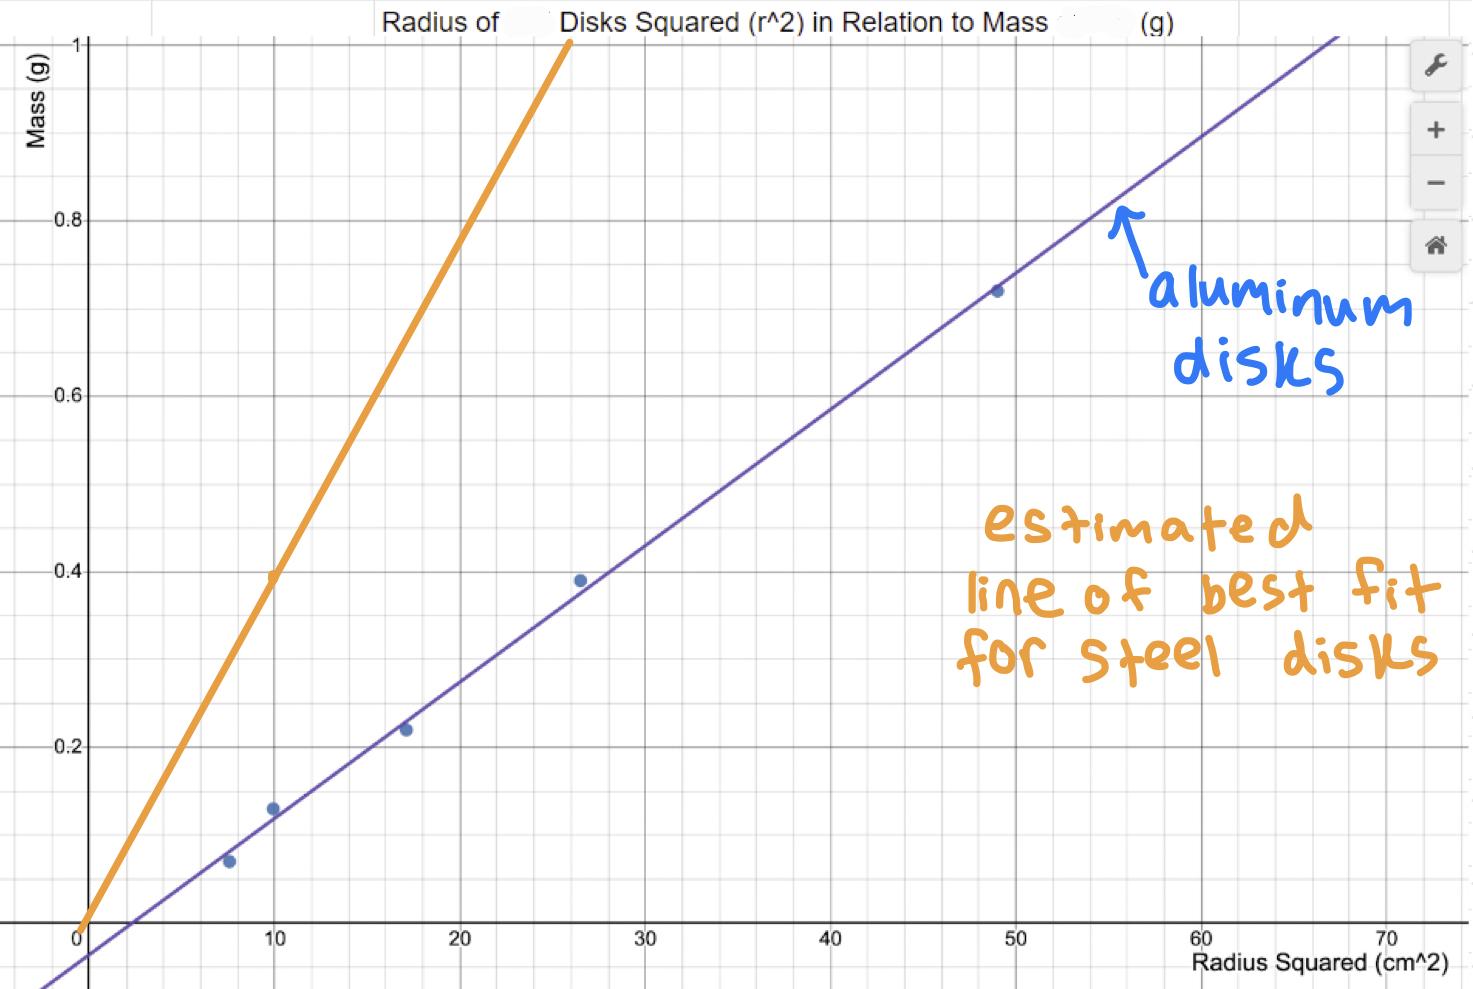
How would your graph of m vs r2 be different if you had used disks of the same thickness, but made out of steel? Draw a second line on your m vs r2 plot that represents disks made of steel.
-
A graph of m vs r2 for disks made out of steel would contain a steeper line of best fit, or one with a higher slope value, than one for disks made of aluminum. This is because disks made of aluminum have a lower density (2.7 g/cm3) than steel (7.85 g/cm3), and working backwards from the slope = (pi)(h of cylinder)(density) equation mentioned in above questions, increasing the density would increase the slope. Since only the density/ material of disks would change, each r2 value would remain the same, while mass would be higher for each steel disk. Hence, the estimated line of best fit for steel disks is steeper by about 7.85/ 2.7 times.
-
-
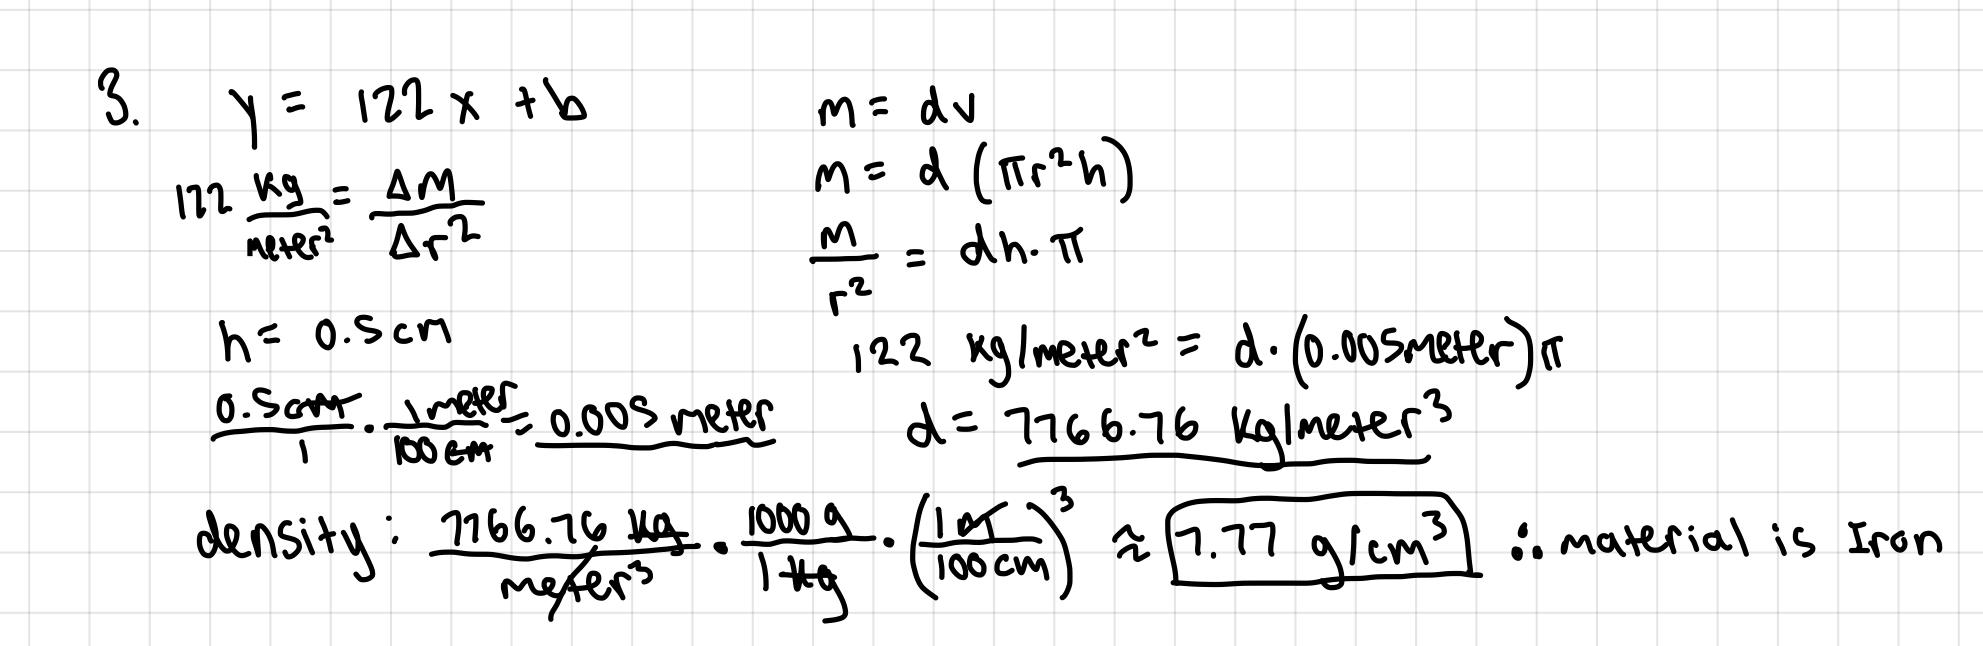
Another group of students has acquired data for the exact same experiment; however, their
disks are made of an unknown material that they are trying to determine. The group’s m versus
r2 data produced a line of best fit with slope equal to 122 kg/m2. Each disk they measured had
the same 0.5 cm thickness. Calculate the density of the unknown material and use the table
below to help determine what material their disks are made of.
-
The density of the unknown material is about 7.77 g/cm3. Therefore, the material of
the disks is likely iron.
Multiple Choice Questions:
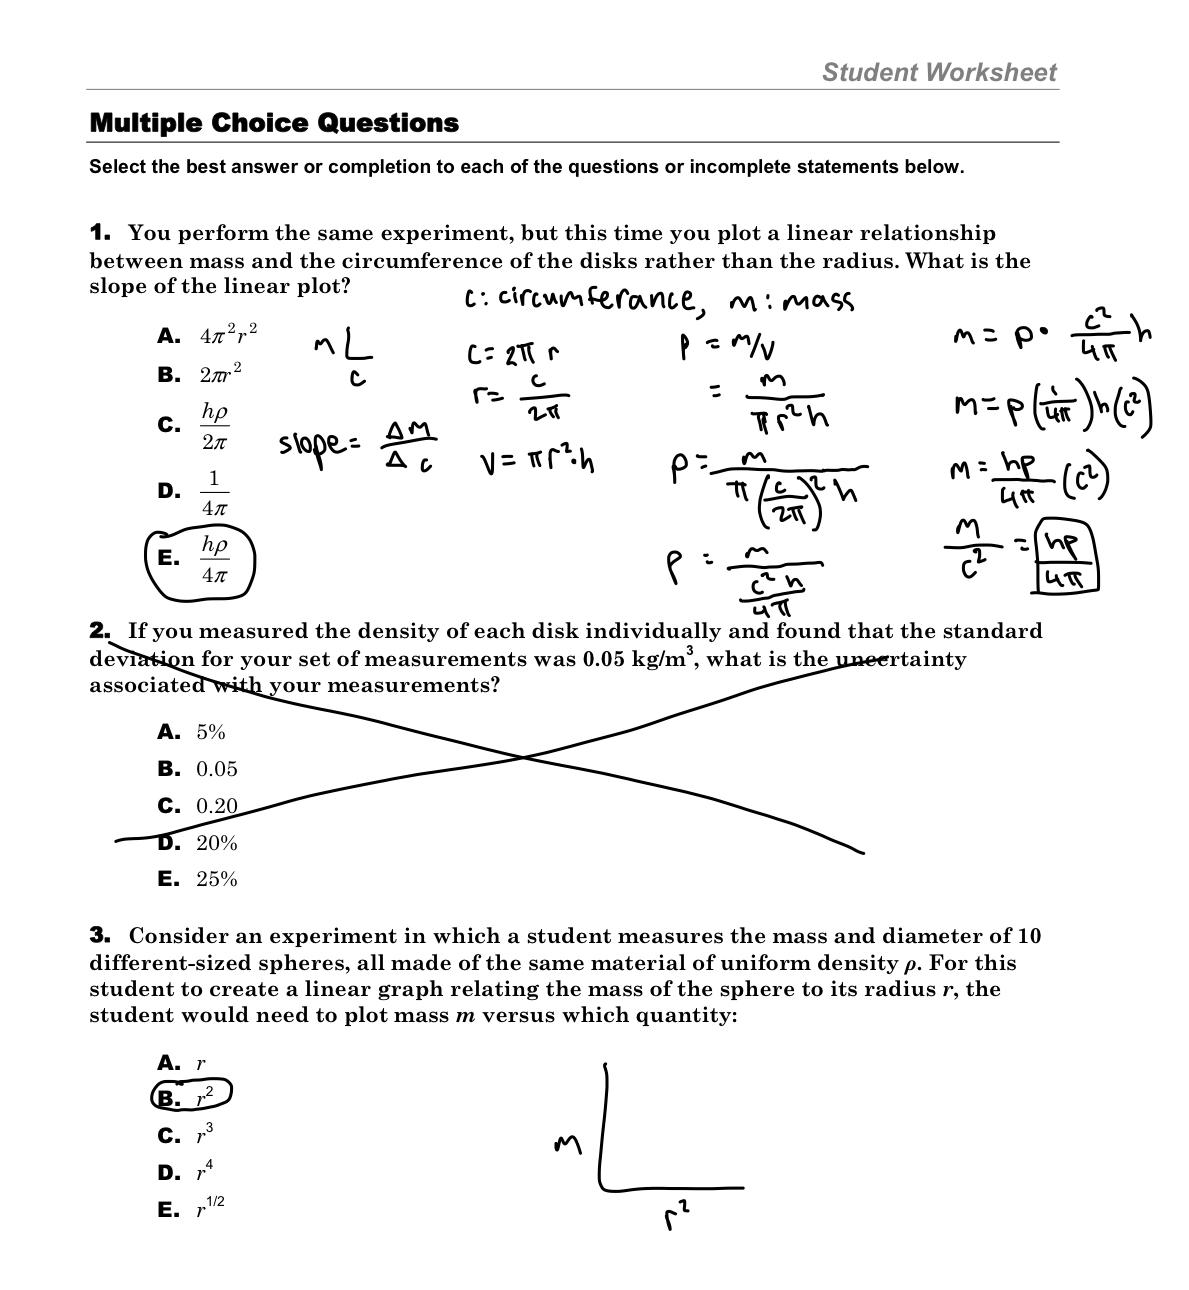
Question 3: The answer is c) r3. Since d = m/v and in this case the volume of spheres are
(4/3)(pi)(r3), the m is linearly proportional to r3.